Watch the video presentation and/or read the full text below
Note: this next exercise is not strictly necessary to complete the model, but it
covers crucial parameters which should always be considered when framing a business
plan.
The graph we drew in the first exercise shows the evolution of the
Penetration input over a default period of ten years (strictly speaking,
from the end of Y0 to the end of Y10).
You may wish to relate your model assumptions to actual calendar years (such as
2021, or whatever year it is when you read this). Additionally, ten years might
be too long for many exercises, and you may wish to set a shorter horizon for the
model results:
-
Select Run Period from the main Data menu (or from the context menu available by
right-clicking anywhere on the view background). The Run Period
dialog is displayed.
-
Enter the Model Start Date and Model Run Length inputs as shown below. The graph
and table are updated to show the evolution of the Penetration
input over the five years, 2021–2025; i.e., from the end of 2020 to the end
of 2025.
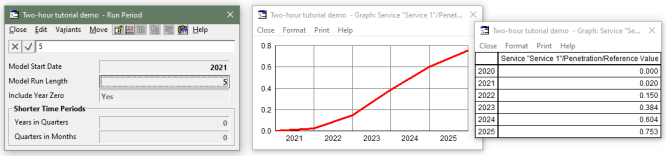
Figure 6: Limiting the Run Period to five years
from 2021
Note: if your reporting year doesn’t start on 01 Jan, then you can enter a
month, such as Apr 2021, or even a specific date for the Model Start Date. Try it!
Reducing the run length removes superfluous detail if you are focused on the nearer
term, but you may seek additional granularity in the results instead, especially
in the crucial launch phase:
-
Ensure the Run Period dialog is still active.
-
Enter the Years in Quarters and
Quarters in Months inputs as shown below. The graph and table are updated
to show additional, intermediate values, by month for the first two quarters, and
then by quarter for the (remainder of) the first two years.
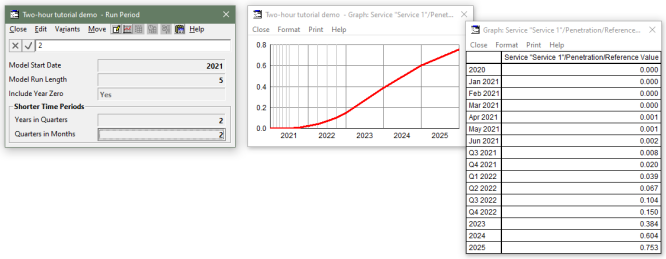
Figure 7: Generating optional quarterly and monthly results from the
Model Start Date
These extra values are available because all time-series inputs are parameterised
with a formula which provides for values to be inferred at any time, rather than
just at yearly intervals. However, with all this extra detail, you may wish to date
your assumptions more precisely too, or you may already have a mid-year data point
to accommodate. Let’s try bringing forward the 15% penetration assumption
(currently end of Y2):
-
Switch back to the S-Curve dialog for the Penetration input.
-
Try replacing the Period B value of
Y2 with Q3 Y2, or even Aug Y2.
Now what?
-
When does the Penetration input reach 15%?
-
How does an Aug Y2 assumption work if the model only has
quarterly results in Y2?
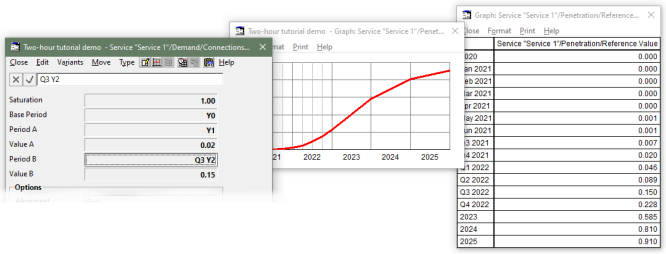
Figure 8: Entering a mid-year data point
This detail for Shorter Time Periods is optional
and automatic, and can be turned on and off at will, as above, without affecting
the integrity of your model. All of the calculations in STEM are ‘period aware’
so you don’t have to waste time on it or worry about it.
The Results program includes a Consolidation option
(to aggregate quarterly or monthly results) so that financial results can be presented
on an annual basis even when the results are generated in quarters or months. (Beyond the scope of this tutorial.)
For sake of simplicity (and to avoid the exhibits aging from the continued use of
calendar years), we will turn these options off for the remainder of this tutorial:
-
In the Run Period dialog, press <Ctrl+A>.
All the fields are selected.
-
Press <Del>, or select Unset from the dialog
Edit menu. All the fields are returned to their
default values, such as Model Run Length = 10, and the graph and table revert to showing annual values.
-
In the S-Curve dialog for the
Penetration input, re-enter Period B = Y2. The graph and table update to show 15% in Y2 once again.
The beauty is that you can enable these options at any time, and your model will
just keep working without having to start from scratch. Try that in a spreadsheet!
Note: the Run Period dialog is (optionally) displayed automatically when you create
a new model, but the design allows for you to revise these fundamental settings
at any time.
 Things that you should have seen and understood
Data menu, view-background menu
Run Period, Model Start Date, Model Run Length
Years in Quarters, Quarters in Months
Using quarters, months or dates for period inputs such as Period B