Watch the video presentation and/or read the full text below
With most services, there is a crucial distinction between how much work is done
(value or volume delivered) and the rate at which this work is done (how busy the
service is). Revenue may be proportional to value delivered, or flat-rate, but the
fixed assets in a system must be dimensioned to deliver the required work at the
busiest rate.
Note: the following preamble will help you understand which inputs to enter in the
service Demand dialog in order to complete the Broadband connectivity service description.
A service in STEM has characteristics of Traffic
Volume and Busy Hour Traffic,
and the separate Traffic Unit and
Busy Hour Traffic Unit inputs can be tailored to the nature of the service.
For example, a voice service might deliver Call Minutes
and be dimensioned in Erlangs (simultaneous circuit density),
while a data service might deliver GBytes at a rate of
Mbit/s (transmission speed). Both unit-label inputs are
relevant, regardless of the Traffic Calculation
(see below), and should always be entered for clarity.
The separate Traffic Volume
and Busy Hour Traffic inputs may be entered independently,
but more commonly the corresponding results are related (one way or the other) by
the Distribution of service delivery over a typical
day, and over the year as a whole.
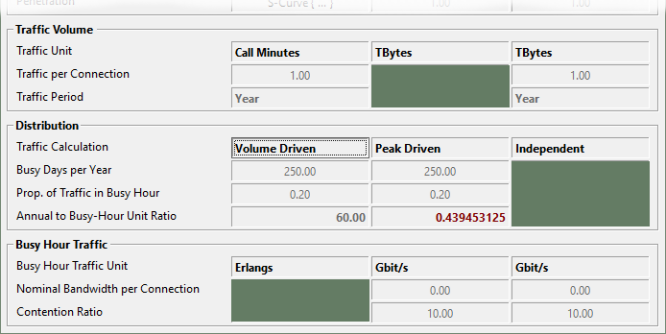
Figure 9: Separate inputs for
Traffic Volume,
Distribution and
Busy Hour Traffic in the
Demand dialog
The Traffic Calculation input is a crucial choice
which determines how the associated inputs are reconciled (one set of which is always
ignored, as per the shading above):
-
Volume Driven:
Traffic is defined by the
Traffic per Connection and
Traffic Period inputs,
Busy Hour Traffic is inferred from
Traffic (according to the
Distribution), and the
Nominal Bandwidth per Connection and
Contention Ratio inputs are ignored
-
Peak Driven:
Busy Hour Traffic is set by the
Nominal Bandwidth per Connection and
Contention Ratio inputs,
Traffic is inferred from
Busy Hour Traffic (with the inverse
Distribution), and the
Traffic per Connection and
Traffic Period inputs are ignored
-
Independent:
Traffic and
Busy Hour Traffic are determined separately,
according to their respective inputs, and the other
Distribution inputs are ignored.
A voice service may be easily characterised in terms of call minutes and distribution
(Volume Driven), while a data service might be all about
speed (Peak Driven), but if you have good data for both
volume and rate, then use Independent.
Important: if Traffic Calculation
is either Volume Driven or Peak Driven,
then the Distribution inputs must be calibrated
in order for the respective Busy Hour Traffic and
Traffic results (which are always available) to
be meaningful. It is very likely that some resources will be dimensioned according
to Busy Hour Traffic, and revenue will be a function
of Traffic unless the service tariff is flat-rate
only.
Note: now we are ready to complete the service description!
According to the introduction, we wish to offer a 100 Mbit/s service, with an optimistic
10:1 contention ratio in the access equipment:
-
Select Demand from the service icon
menu. The Demand dialog is displayed, as per the
figure below (which also illustrates the required inputs which follow).
-
Enter the Traffic Unit and
Busy Hour Traffic Unit inputs first
for clarity. Remember that the results are aggregated across many customers, so
it is usually better to work with units ‘up one order of magnitude’
from the per-customer perspective.
-
Enter the Traffic Calculation next,
as this governs which other inputs are required.
-
Enter the Nominal Bandwidth per Connection
and Contention Ratio inputs.
-
The Busy Hour Traffic result will
be calculated directly as Connections ×
Nominal Bandwidth per Connection / Contention Ratio.
(We will verify the numbers shortly.)
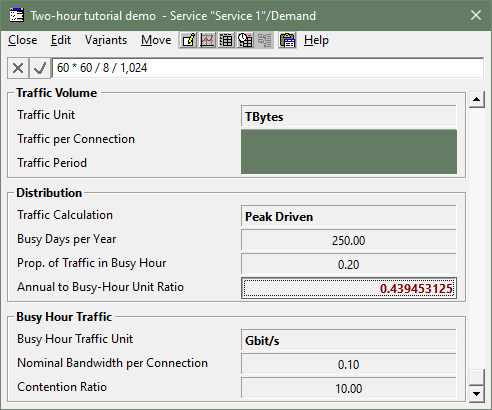
Figure 10: Entering the
Busy Hour Traffic and
Distribution inputs for the
Broadband connectivity service
Note: it is not essential at this stage, but it is nevertheless
highly recommended to set the Distribution inputs at this stage so that the Traffic
(volume) result will also be meaningful.
-
Enter the Busy Days per Year input
at the default value of 250.0 (corresponding to a business
service with no significant usage at weekends or on public holidays).
-
Enter the Prop. Of Traffic in Busy Hour
input at the default value of 0.2, and consider what this
means.
-
The Annual to BH Unit Ratio input is crucial, and requires careful thought. Helpfully,
the default value of 60.0 (for Call Minutes
and Erlangs) provides a helpful clue as to the sense of
the ratio. In this case, we are converting from seconds to hours, from bits to bytes,
and from GB to TB (for Gbit/s and Tbytes).
-
Enter the value as a formula so that the separate factors are visible (see above).
-
The Traffic result will be calculated as
(average over the period) Busy Hour Traffic × Annual to BH Unit Ratio / Prop.
Of Traffic in Busy Hour × Busy Days per Year.
This provides only a very crude estimate of the traffic volume, as it assumes the
service is fully-utilised throughout the busy hour. Why might this overstate the
likely traffic volume? You may wish to refine the
Contention Ratio and
Prop. Of Traffic in Busy Hour inputs according to a
careful analysis of the expected daily usage pattern.
(Beyond the scope of this tutorial.)
 Things that you should have seen and understood
Traffic Calculation
Traffic Volume: Traffic Unit, Traffic per Connection, Traffic
Period
Distribution: Busy Days per Year, Prop. Of Traffic in BH,
Annual to BH Unit Ratio
Busy Hour Traffic: BH Traffic Unit, Nominal Bandwidth per
Connection, Contention Ratio