You can also view the interpolated series as a table, which will display how STEM has interpolated values for intervening years – years for which you have specified no data.
- With the graph still displayed:
-
select Show Graph as Table or Show Separate Table from the Format menu, or
- right-click on a blank area of the graph to display the Format pop-up menu and then select the Show Graph as Table or Show Separate Table command.
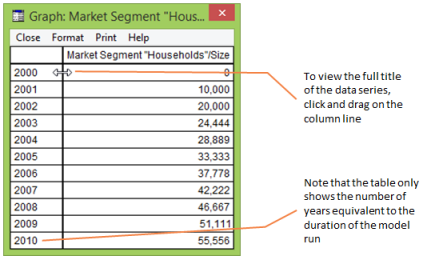
Tabulated data of the Interpolated Series for Demand
-
Select Show Table as Graph or Show Separate Graph from the Format menu to return to the graph.
- Select Close from the Graph dialog menu to close the graph and return to the dialog.
- Select Close from the dialog menu to close the Interpolated Series dialog.