A scenario comparison graph can be drawn using the comparison controls (Base and Operation) in the Draw dialog:
- Enter the Draw dialog and select the element(s) of interest in the Elements tab (e.g., Network).
- In the Graphs tab, select the result you want to graph (e.g., NPV).
- Switch to the Scenarios tab and select the scenarios of interest (e.g., Dual/None, Dual/Base, Dual/All and Dual/Just Video).
- Select the appropriate operation (e.g., Difference) from the Operation drop-down menu in the Comparison control section.
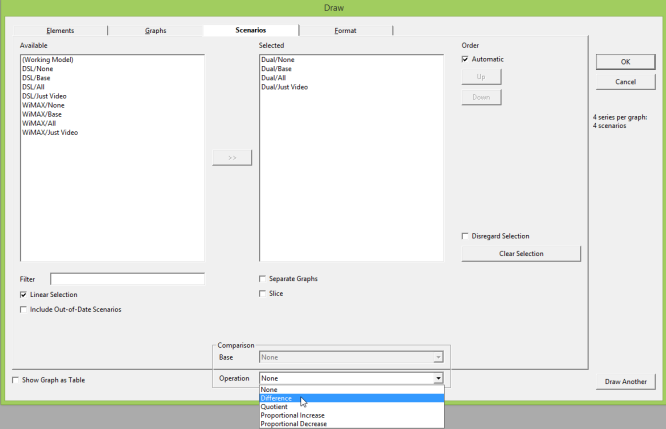
Figure 1: Selection of Difference operation from the Operation drop-down menu
- Determine which scenario you want to be your base scenario (e.g., Dual/Base). Select this scenario from the Base drop-down menu in the Comparison control section at the bottom of the dialog.
- Alternatively, you can drag the desired scenario from the Selected box to the Comparison area. You have to drag ‘right a bit’, avoiding the Selected box, so that it understands you are not trying to change the selection. The Operation will be set to Difference automatically if not previously defined.
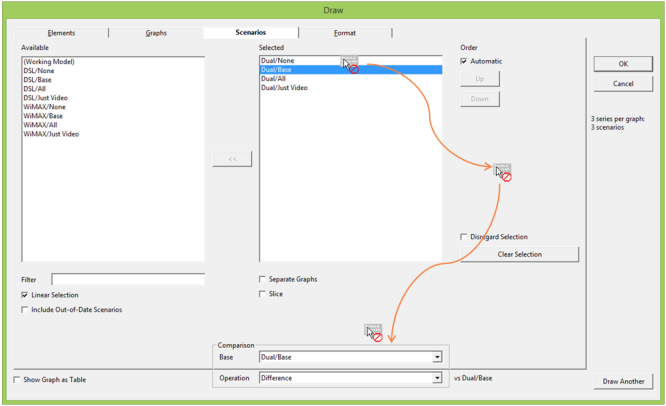
Figure 2: Dragging the base scenario (Dual/Base) ‘right a bit’ and onto the Base drop-down menu
Note: notice that the scenario selected as the base is displayed alongside the Operation box (i.e., ‘vs Dual/Base’). This is displayed across all tabs for clarity.
- Press OK to draw the graph. A graph of NPV for three scenarios compared with the Dual/Base scenario is drawn.
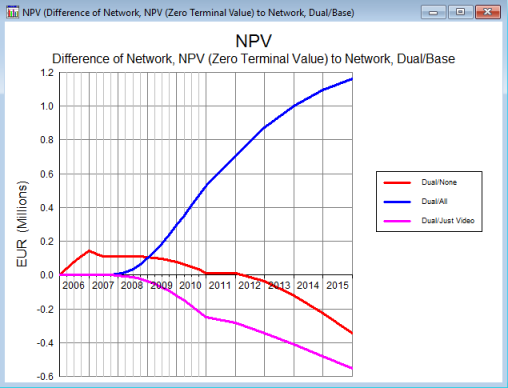
Figure 3: Difference graph of NPV for three scenarios compared with a base scenario (Dual/Base)
The same approach can be used to select a base element in the Elements tab (and even in the Variants tab, but that is another story).