As well as Difference, there are three other modes for displaying the graph data: Quotient, Proportional Increase and Proportional Decrease. Quotient is described in more detail in Permalink ‘04030500’ not found – both proportional increase and proportional decrease are new in STEM 7.5.
-
Proportional Increase: x/b – 1
-
Proportional Decrease: 1 – x/b
These new modes could be used to communicate how much more profitable various scenarios are relative to the base (or cheaper if using proportional decrease).
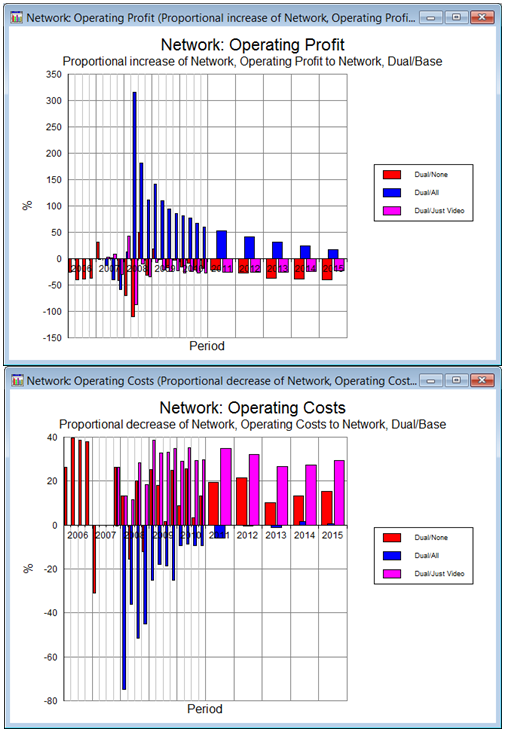
Graphs of Proportional Increase vs Dual/Base and Proportional Decrease vs Dual/Base