In this example, we are using the same WiMAX-DSL example model as has been used throughout.
- Check that Cost Breakdown = Transparent in the Data/Other Details dialog in the Editor, and run the model, including all scenarios.
- Select Draw in the results program and select the services for which you want a cost breakdown in the Elements tab (e.g., DSL access and WiMAX access).
- Move to the Cost Breakdown tab. A list of Available resources will be shown: only resources that are either directly or indirectly driven by either DSL access or WiMAX access will be listed
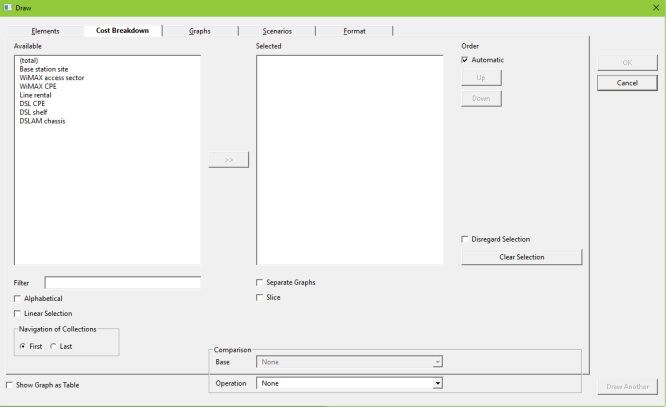
Figure 1: List of Available resources – those driven either directly or indirectly by selected services
- Select the contributing resources you want to include (most likely all, unless some are collections) and add them to the Selected list (e.g., DSL shelf and WiMAX access sector). The resulting graph will show all available service/resource combinations (e.g., DSL access/DSL shelf, DSL access/WiMAX access sector and WiMAX access/WiMAX access sector; DSL shelf does not contribute any costs to the WiMAX access service, so WiMAX access/DSL shelf will not be shown).
- Switch to the Graphs tab and select the result you want to draw (e.g., Operating Charge).
- Press OK to draw the graph.
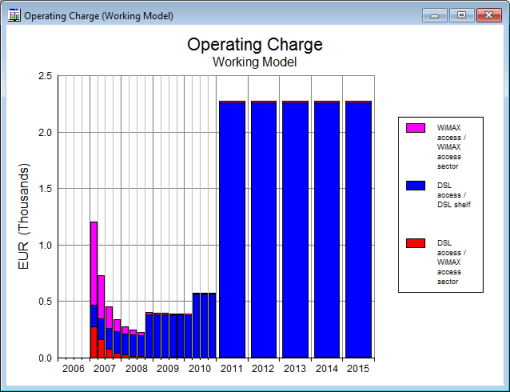
Figure 2: Cost breakdown for service/resource Operating Charge
As well as the list of Available resources, there is also a (total) option. (total) means the original total result for the service(s), without cost breakdown for each resource. If you don’t select any resources in the Cost Breakdown tab, the total for the service(s) selected will be shown on any resulting graph. Alternatively, you can choose to draw the (total) result on the same graph as specific service/resource pairs.
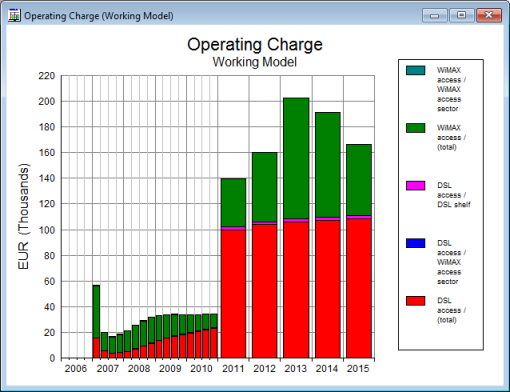
Figure 3: Operating Charge graph showing (total) values for WiMAX access and DSL access services, as well as cost breakdown for specific service/resource pairs
By default, you select the resources independently in the Cost Breakdown tab, leading to selection of all implied service/resource combinations. However, as in the Variants and Scenarios tabs, you can check the Linear Selection box to show explicitly all the available service/resource pairs. This enables you to choose a sparse selection of service/resource pairs to graph if you prefer, rather than all possible combinations.
In the example below, with Linear Selection checked, specific service/resource pairs have been added to the Selected list, rather than all possible combinations for a particular resource.
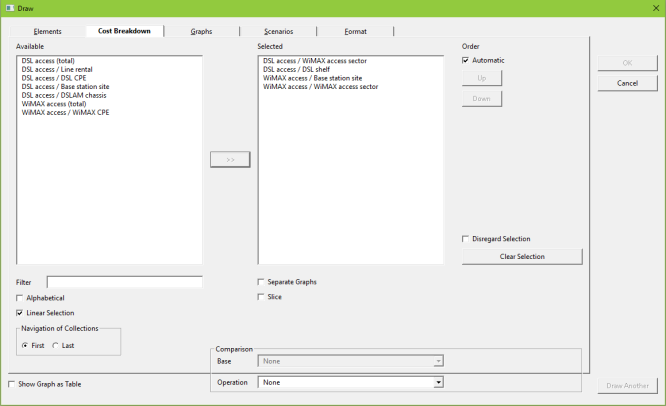
Figure 4: Selection of specific service/resource combinations when Linear Selection activated
When Linear Selection is activated, (total) is replaced by the actual service names, i.e., DSL access (total) and WiMAX access (total), followed by the familiar list of available service/resource pairs.
As in other tabs, you can choose to select the Separate Graphs option if you would prefer each result to be shown on a separate graph. You can also choose to list the Available resources alphabetically if you prefer (Alphabetical option). If you select Disregard Selection, then if you have made a selection of service/resource pairs, these will be temporarily disregarded and the (total) result will be graphed instead. Your selection can be easily reinstated subsequently by unchecking Disregard Selection.