Finally we shall look at the Video service, which is ultimately rather more complicated when we consider how the content is actually delivered from original source to the customer, via video servers at the exchange.
For this exercise we shall again return to the original model, so please close the results, switch back to the Editor, close WiMAX-DSL09 and re-open WiMAX-DSL02.
 Save the model as WiMAX-DSL10
- Return to the Demand dialog for all three services and look at the column for Video.
- The penetration input for this service is entered as an S-Curve. Take a few moments to look at the parameters, and press to see how these are interpreted over time.
- The initial dimensioning model is similar to Internet Access, but with a peak bandwidth of 5.5Mbit/s for a single video stream and contention ratio of 20.0. (Usage surges are more likely for video, where a popular program may draw many simultaneous viewers.)
These parameters define the video bandwidth to the customer, but we have a different model for the background streaming from original source to the video server at the exchange.
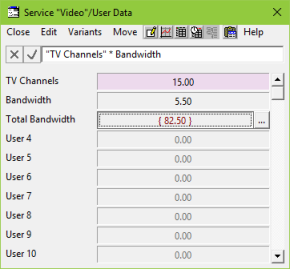
- Select User Data from the Video service icon. You will see that two inputs, renamed as TV channels and Bandwidth, are used to calculate a Total bandwidth for the background video update.
Expression transformation
- Close this dialog and open the Input and Transformation dialog for the transformation, Backhaul bandwidth.
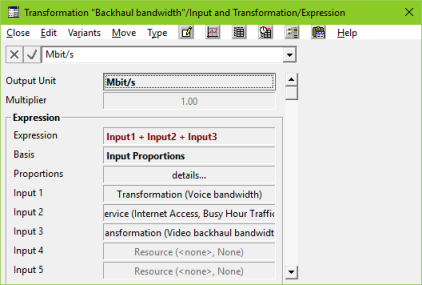
- You will see that in this transformation the Output is defined by a simple expression: Input1 + Input2 + Input 3, where Inputs 1–3 are the Output of the Voice bandwidth transformation, the Busy Hour Traffic input from the Internet Access service and the Output of the Video backhaul bandwidth transformation, respectively.
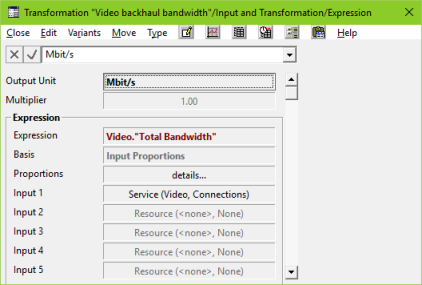
- Close this dialog and open the Input and Transformation dialog for the transformation, Video backhaul bandwidth. This transformation takes the number of subscribers as its input, but then defines its output independently using a formula which refers to the user data described in point 4 above.
 Save and run the model
- Draw the following graphs and see if they match your expectations. (Try to work out the orders of magnitude in your head first.)
- Busy-Hour Traffic (Video)
- Connections (Video)
- Traffic (Video)
- Instantaneous Output (Video backhaul bandwidth).
Try varying the Contention Ratio and TV channels inputs to see which results are affected. Does this make sense?
 Things that you should have seen and understood
User Data, Expression Transformation