For this exercise we shall return to the original WiMAX-DSL model, so please close the results, switch back to the Editor, close WiMAX-DSL06 and re-open WiMAX-DSL02.
 Save the model as WiMAX-DSL07
-
Click first the icon for Voice, and then <Shift>-click the icon for Video. Three icons are selected: Voice, Internet Access and Video.
-
Right click the last icon (Video) and select Demand from the common icon menu. A tabular Demand dialog is displayed with one column for each of the selected elements.
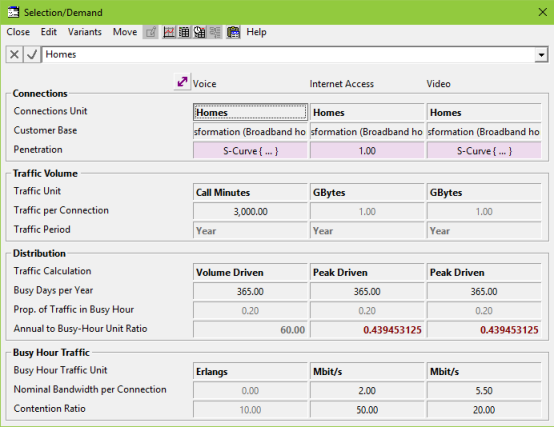
- Look at the inputs for Voice. You will see an assumption of 3000 Call Minutes. This is the annual volume for an average subscriber, which is a bit less than 10 minutes a day.
- Look at the next group of inputs. We assume that this volume is spread over 365 days in the year. (It would be fewer for a business service.) On a typical day, 20% of the traffic presents in the busiest hour. A unit conversion factor of 60.0 is provided to convert from minutes to an average calling rate measured in hours per hour.
-
Note that the Busy-Hour Traffic Unit for Voice is Erlangs. The busy-hour traffic is calculated from the assumptions above and here the remaining inputs for Voice are disregarded.
- Move the Demand dialog to one side and click the icon labelled Voice channels. This is an Erlang transformation.
- Select Input and Transformation from the icon menu and review the inputs. You will see that it takes the busy-hour traffic from the service as an input and applies a 0.5% Grade of Service (GoS) assumption to calculate a requirement in channels.
What do you think this means? How would you find out more?
Multiplier transformation
- Close the dialog for the Erlang transformation and open the inputs for the next transformation, Voice bandwidth. You will see that it takes the output of the Erlang transformation (in channels) and applies a multiplier of 64 / 1000 to convert to required bandwidth in Mbit/s given an assumed 64kbit/s bandwidth per circuit.
 Save and run the model
- Draw the following graphs and see if they match your expectations. (Try to work out the orders of magnitude in your head first.)
-
Busy-Hour Traffic (Voice)
- Connections (Voice)
- Traffic (Voice)
- Instantaneous Output (Voice channels)
-
Instantaneous Output (Voice bandwidth).
Check that you are in the Graphs tab rather than in the Results tab (STEM will retain your options from a previous Draw session).
- Try changing the assumptions for Traffic per Connection and GoS to see how they influence the results.
 Things that you should have seen and understood
Traffic Volume, Distribution, Busy Hour Traffic
Erlang transformation, Multiplier transformation
Apply to all selected graphs