Now we are going to look at some of the results of the model.
 Save the model as WiMAX-DSL02
To make it easier to jump back to earlier exercises, and as a kind of simple version control to recover from any inadvertent changes you may make along the way, we will save a new copy of the model for each exercise.
-
Select Save As… from the File menu and modify the filename to show the exercise number at the end, like this: WiMAX-DSL02.
Use ‘02’ rather than just ‘2’ so that the model names will sort in the right order in the Open Model dialog when the numbers get into double digits!
 Run the model
As the WiMAX-DSL model is pre-programmed with a number of scenarios, the process for generating the results is slightly longer than for a simple model where you would just select Run from the File menu or press <F5>.
-
Select Scenarios and Sensitivities… from the File menu, or press <Shift+F5>. The Scenarios and Sensitivities dialog is displayed.
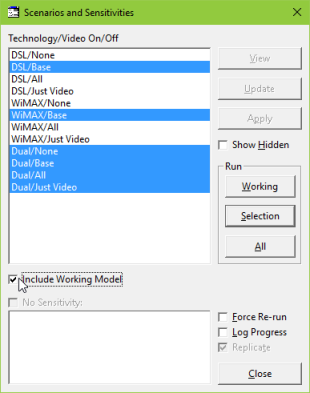
The model includes independent scenarios for technology and the provision of video, and a pre-defined selection indicates the technology × video combinations of most interest.
The specific data for each defined scenario are applied to the relevant inputs of the ‘working model’ (which you see in the Editor) when each scenario is run in turn. Separate results are available for each scenario, and also the working model.
For now it is easiest to run everything, as the entire process is very quick for such a small model.
-
First select Include Working Model (below the list of scenarios).
Note: the Working Model is the model that uses the actual working values in the normal data dialogs.
-
Then click All (in the box labelled Run) or press <Alt+A>. The model is first saved to disk before the scenarios are generated and run.
Once the working model and scenarios have been run, the updated results are automatically loaded into the STEM Results program, where a series of charts is displayed in the following views from a pre-defined workspace.
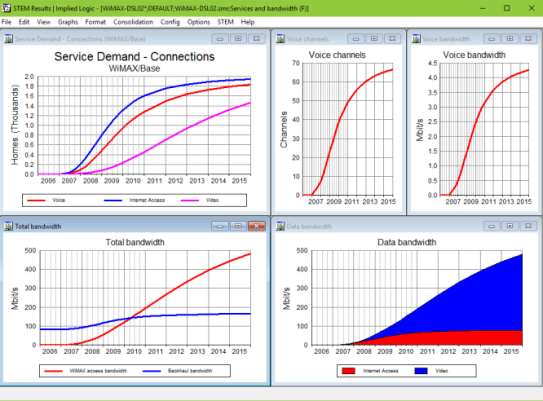
The first view displayed includes five charts which display the following results:
-
Connections for the three services, Voice, Internet Access and Video
-
Voice channels
-
Voice bandwidth
-
Total bandwidth on WiMAX access and Backhaul
-
Data bandwidth for Internet Access and Video.
Right-click the background of any chart, or select Format from the main menu, and then select Show Graph as Table or Show Separate Table to display the numerical data.
The pre-defined workspace includes five other views.
- Select View from the main menu in the Results program. The View menu is displayed, listing each of the pre-defined views.
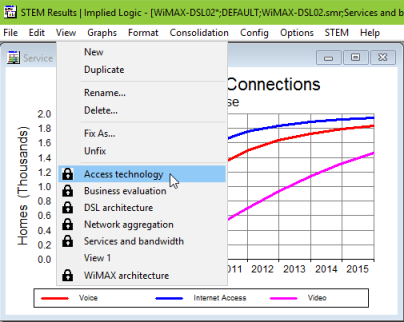
- Select Access Technology. As we have altered the previous Services and bandwidth view by changing a graph to a table, STEM asks whether we should Retain changes to fixed view ‘Services and bandwidth’?
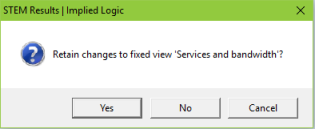
- Select No. The selected view is displayed.
- Look through each of the views in turn to get a feel for the range of results generated. The logic behind these results is explained later.
Select Current Window from the Help menu or press to access the help system, which contains an alphabetical listing of every STEM result (with an explanation and definition) and links to documentation of each of the relevant calculation topics (model features).
- Connections in the scenario for DSL access only
- Connections in the scenario for WiMAX access only
- Connections for both technologies in the dual scenario.
-
DSL access connections
-
DSL shelf: installed, slack and used capacity
- Utilisation ratio for DSL shelf and DSLAM chassis
-
DSL shelf: installed and incremental units.
-
WiMAX access bandwidth
-
WiMAX access sector: installed, slack and used capacity
-
WiMAX access sector: planned units, deployment units, used units
-
WiMAX access sector: installed and incremental units.
-
Service revenue: DSL access, WiMAX access, voice and video
-
Resource capital expenditure: CPE and access network elements.
-
Network operating profit
-
Network operating profit margin
-
Network net present value (NPV) – technology scenarios
-
Network NPV – video scenarios
You can use <Page Up>
and <Page Down> to step through these views, rather like a slideshow.
In fact, many more detailed results are also available for each element and scenario, as we shall see in the later exercises.
In order to have a good starting point for the exercises to follow we will prepare a clean view for the model in the Results program.
Create an empty view by selecting New from the main View menu. (If prompted to save changes to an existing protected view, select No). A blank View 1 appears. Select Save Workspace from the File menu (or press <Ctrl+S>) – the workspace will be saved as WiMAX-DSL02. This model will be used as the default model in later exercises; it corresponds to the original model with an additional empty results view.
 Things that you should have seen and understood
Run, working model, scenarios.
Workspace, results view, graph, show graph as table.
View menu, page up/down, help system.
New View, Save Workspace.