Although manual replication is feasible with STEM’s intelligent copy-and-paste function, this approach is labour-intensive, subject to user error, and does not help much if you want to add something to the calculation structure later. In contrast, the template replication technique which we shall explore now allows you to identify template elements which will then be replicated automatically whenever you re-run the model. This means that any new structure added to the template later will be propagated automatically across all sites.
Detailed and consistent results are generated for each individual site, as well as for the network as whole. If you proceed to add scenarios or sensitivities, you are guaranteed that these will impact equally on all sites. The further you go with this sort of analysis, the harder it gets to keep everything consistent in a spreadsheet, whereas STEM is purpose-built with this kind of process automation in mind.
We shall revert to the WiMAX-DSL39 model for this exercise, picking up with the model as it was before we did the manual copy and paste.
 Save the model as WiMAX-DSL41
To avoid breaking any dependencies between the elements in the model, this time we are going to replicate everything except the scenario elements.
- Press <Ctrl+A> to select all the visible icons (or select Element menu/Select All Visible).
- Hold down the <Ctrl> key and click the two dimensions, Technology and Video On or Off, and their related variants, in turn to remove them from the selection.
- Click the
 button on the toolbar and then click again within the view to create a new template element. Name it City. The previously selected elements are linked to the template, and a shaded rectangle is drawn around them.
- You can hide the dark blue links by right-clicking one and selecting Hide from the popup menu which appears.
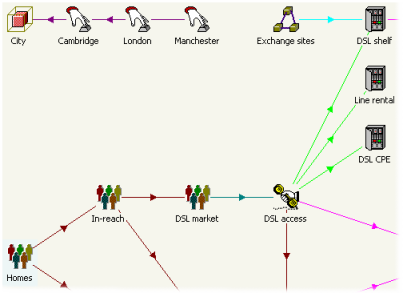
- Move the City icon to the top left, in line with the Homes market.
- First select the City template icon, and then create three new variant elements using the
 button on the toolbar, giving each the name of a city.
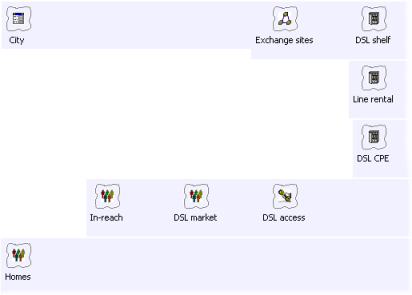
- Position the variant icons alongside the City template. We use the following layout as the basis for subsequent illustrations.
- Go to the Size input for the Homes market (icon menu/Details).
- Left-click to make sure that the Size input field is selected, and then select Create Replicas from the dialog Variants menu. The Choose Template for New Parameter dialog is displayed.
- Select City from the list, as opposed to <new Template>, and click OK. STEM automatically creates a table with one row for the Size input and one column per variant, and allows you to just type in the varying values without repeating the entire calculation structure, ensuring consistency of calculation and results across all sites.
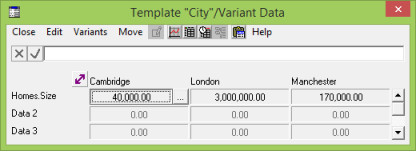
- Enter appropriate values for each of the cities you have defined.
 Save and run the model
If the Resource Capacities graph is still displayed, it will look very similar, except that it will show a capacity in the millions of ports. The chart is still labelled DSL shelf as if nothing else had happened.
- Draw the graph again, but this time look more carefully in the Choose elements to draw dialog.
- Check the box to sort the list of elements in alphabetical order and scroll through the list. For each of the original elements, you will see variants for each of the cities you defined.
- Draw the same graph for each of the copies of DSL shelf that you defined (not all on the same graph). The same consistent calculations are performed for each site in turn, installing different numbers of shelves according to the market size specified for each city. But you didn’t have to do any manual copying, and this time the elements have intelligible names!
- Go back to the Editor and add the Sites input for the Exchange sites location as a parameter for the template, using the same technique as before. You should end up with a second row in the template.
- Then enter sensible numbers for each of the cities you have defined.
When you re-run the model, the numbers you have entered will be inserted automatically into the appropriate calculations and you should end up with more plausible results per city, something like this:
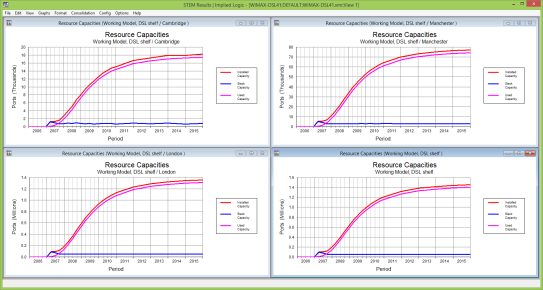
Note: this image was created with Monte Carlo Factor = 2 and Distribution = Extended Monte Carlo.
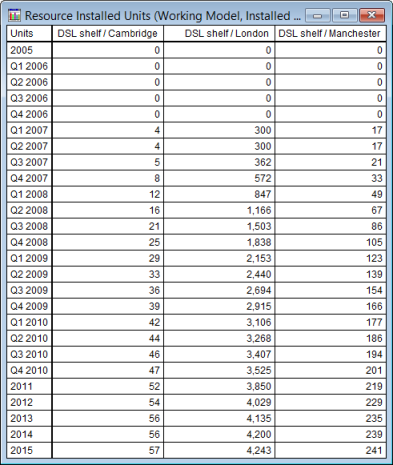
- Or you can combine all elements on one graph for single results to get stacked charts of capital expenditure or operating costs, or to show a table with installed units to provide an inventory by city:
So how does this actually work, and how can you verify what the template is doing for you?
- Go back to the Editor and select Replicate from the File menu.
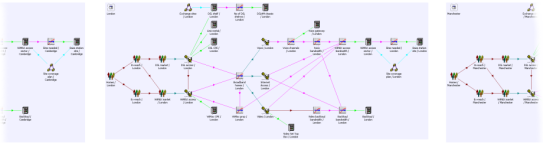
The Editor will load the replicated model, WiMAX-DSL41.exp.dtl, which should look something like this:
Each of the elements you can see is a Collection, which you should recall from Exercise 16: Adding sub-totals with Collections. So, for example, if you hover with the mouse over the City element, then you will see a tooltip which indicates that this aggregates the cities you have defined; and if you hover over the DSL shelf, then you will see that it aggregates individual DSL shelf elements for each of those cities. This is how the original DSL shelf results which first appeared when you ran this model were calculated: as an aggregation of the individual, per-city calculations.
- Use the zoom window or the scrollbar to explore to the right.
You will see separate copies of all of the replicated elements for each city that you defined, again something like this:
- Hover over the Homes or Exchange sites elements for each city. You should see the respective variant data plugged into each element.
If you are wondering whether the changes we have made in this exercise will compromise the scenario structure, then think again. You will find that you can select scenarios to run as usual and create graphs comparing overall NPV from detailed calculations over as many cities as you like.
For the Technology dimension, this is trivial because it just acts on the two global Do DSL and Do WiMAX flags; whereas this is more clever for the Video On or Off dimension, which acts on the penetration of the services which we have just replicated.
This works because the scenarios are applied to the original elements before they are replicated. So the service penetrations are modified first, and then replicated identically into the individual copies per city.

If you want to define scenarios for inputs which also vary by city, i.e., for inputs which are identified as template parameters, then you will need to define scenarios for the respective template variant data. Fortunately STEM automates this too: if you ask to create scenarios for the original input, then STEM will create one row in the dimension variant data for each column in the respective template variant data. Try it!
More or less the same rules apply for sensitivities, too.
As you have seen in this model, we are combining per-city calculations with the Extended Monte Carlo deployment model within each city.
When constructing a large-scale, national model, it is usually counter-productive to model at the per-site level. As an alternative to modelling individual cities, you could use each copied set of elements to represent a geo-type, such as rural, urban or metropolitan, and use the Exchange sites locations to define the number of sites in each geo-type.
 Things that you should have seen and understood
Template replication, aggregate results
Template, Variant, Parameter, Variant Data, Replicate, Collection