Suppose we extend this model to cover a significant number of cities. This is not a great effort, now that STEM is automating the replication. But you may like to group the results by region for reporting purposes. You should again recall Exercise 16: Adding sub-totals with Collections. Now we will apply the same principle to our cities.
Please close the expanded model before proceeding.
 Save the model as WiMAX-DSL42
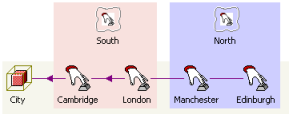
- Select the City template again and create some more cities, perhaps from several different countries, so that each country or region has several cities.
- Define new values for each parameter in the template variant data (template icon menu/Variant Data).
- Hold the <Ctrl> key and click to select the city variant elements for one region or country.
- Click the
 button on the toolbar and click again within the view to create a new Collection. Name it according to the region or country.
- Repeat the preceding two steps for the remaining regions or countries until you have something like this:
 Save and run the model
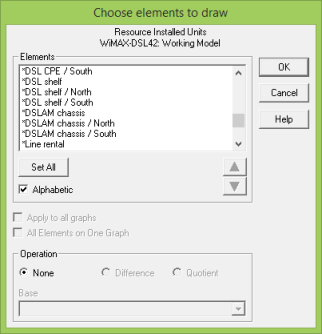
- Draw a graph of Resource Installed Units and look at the elements defined in the Choose elements to draw dialog.
As well as the individual copies of the DSL shelf for each city, and the *DSL shelf entry for the overall collection, you will also see entries like DSL shelf North and DSL shelf South, which will provide totals aggregated over the respective regions.
- Go back to the Editor and look at the replicated model.
You will find additional groups of Collections for each region. For example, the Collection DSL shelf South identifies the two resources DSL shelf/Cambridge and DSL shelf/London. Thus STEM will fully automate this kind of regional aggregation, and will keep it up to date when you add new elements to the template, or new cities to the model.
 Things that you should have seen and understood
Aggregation of template variants
Collection