The other graph format controls in the Format tab can be used to override the usual autoformat algorithm.
For example, the automatic setting for the resource Operating Charge graph for several scenarios is an unstacked column chart, as there is no intrinsic reason to ‘add up’ the results from different scenarios. However, if you want to change it to a stacked format:
- In the Format tab, change the graph Style to stacked.
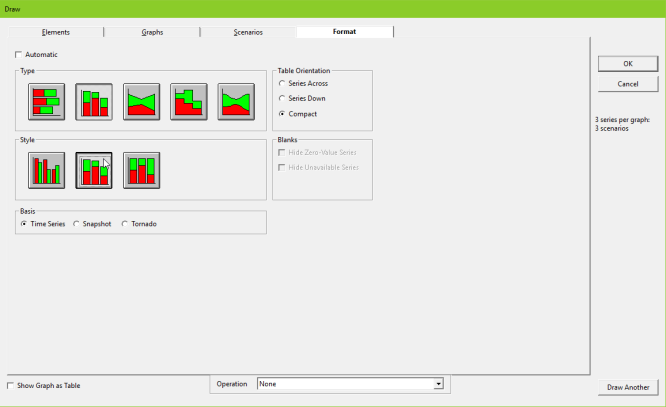
Figure 1: Selection of alternative graph Style option in the Format tab
- Press OK to draw the graph.
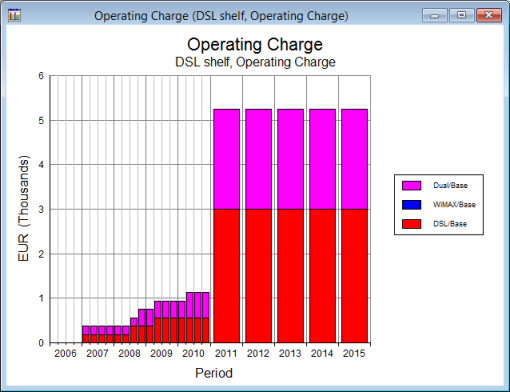
Figure 2: Resource Operating Charge for three scenarios in a stacked column format
The graph Type can be changed in the same way.