Graph formatting options are split across several separate dialogs in order to streamline and make more consistent how the formatting options are applied across one or more charts:
-
Type: line, column, etc., according to graph definitions in default.cnf
-
Components: inclusion of model name, grid lines and legend (and its position)
-
Layout: line thickness, proportional spacing, bar overlap and spacing (or table layout options such as Series Across / Series Down, if a table is selected)
-
Font: base for all graph text items (or table font, if a table is selected)
-
Colours: series and components.
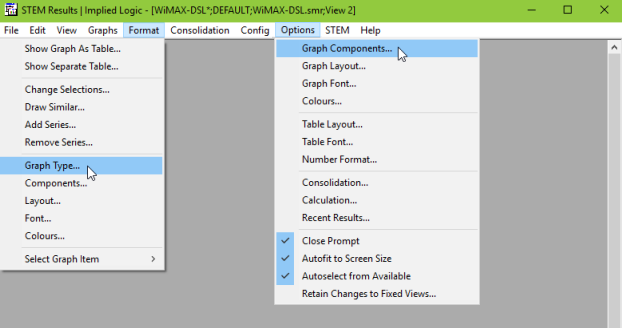
Per-graph dialogs accessed from the Format menu; global settings from the Options menu
When accessed from the Format menu (or context menu for a graph or table), the options presented are those for the current graph (or table). Consistent choices for Apply to in every dialog allow the settings to be carried over optionally to other charts in the view or workspace, or to replace the current workspace and/or program defaults for future charts. (The same options are also now available for many individual graph items such as title and label fonts and so on.)
Similar items on the Options menu lead to dialogs which present the current workspace defaults. Consistent choices for Apply to in every dialog allow the settings for one or more charts in the view or workspace optionally to be reverted to the relevant defaults.
See 5.5 Consolidating monthly or quarterly results for per-graph consolidation options and the option [not] to show Y0.
Note: these options are for formatting a graph after it has been drawn. However, you can also specify how you want the graph to be presented before you draw it, using the options in the Format tab in the Draw dialog (see 5.2.7 Choosing another format for a graph).