Selection of Graph Type… from the main Format menu or by right-clicking on a graph and selecting Graph Type… from the drop-down menu will take you to the Graph Type dialog. This dialog controls the basic type of a graph (bar, column, line, squared line or smoothed-line), as well as the relevant style (regular, stacked or 100%; lines and markers, markers only).
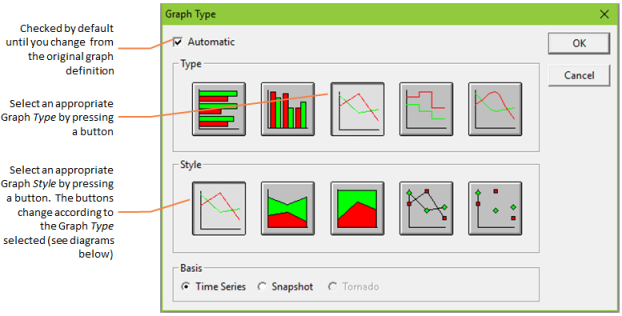
Figure 1: The Graph Type dialog only ever applies to the current graph
These choices are governed by the original graph definitions in default.cnf (5.13 Defining graphs and tables) or your own choices in the Format tab of the Draw dialog (see 5.2.7 Choosing another format for a graph). There are no corresponding defaults and it would rarely make sense to apply these options to more than one chart at a time. So, this dialog only ever applies to the current graph and does not have the general Apply to controls mentioned in 5.8 Formatting graphs.
See 5.1.3 Smart labelling for time-based charts for an explanation of how time-based charts are presented and labelled from STEM 7.4 onwards.
Different GraphTypes and Styles
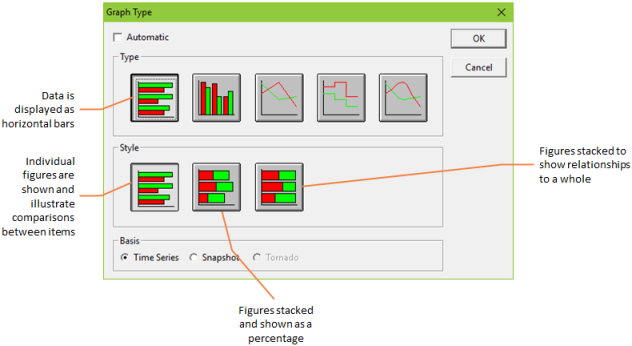
Figure 2: Horizontal bar graphs
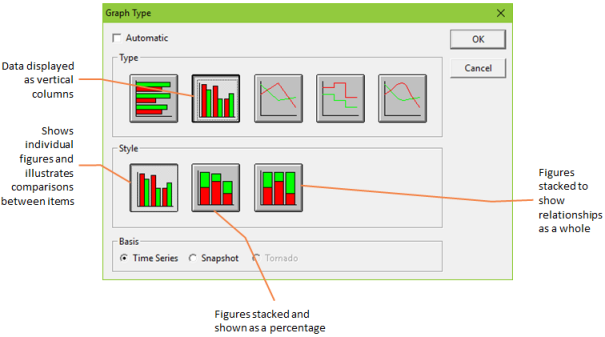
Figure 3: Column bar graphs
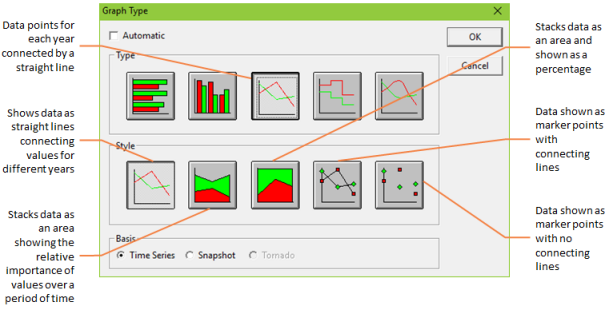
Figure 4: Line graphs
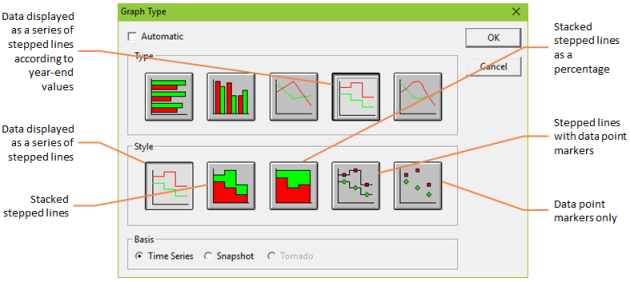
Figure 5: Squared line graph
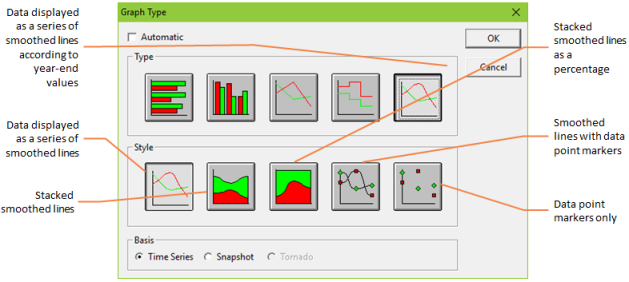
Figure 6: Smoothed line graph