It is possible to specify a preferred set of colours for graphs as a program or workspace default. Obviously the whole point of having a colour palette is to ensure consistency between charts, but if you ever have a compelling reason to use a different set of colours on one particular chart, then you can proceed as follows to override the standard palette.
-
Select Colours… from the Format menu or context menu for the graph. The Colours dialog for this chart is displayed. Usually the Default button will be disabled, indicating that the colours are governed by the workspace or program defaults.
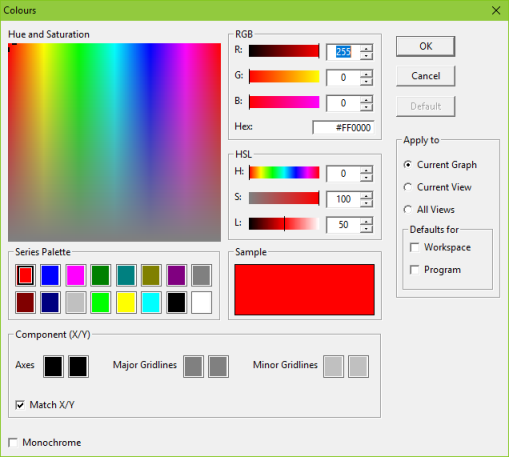
The Colours dialog for an individual graph
- For each of the colours that you wish to change in turn:
- click to select the relevant colour box
- use whichever of the RGB or HSL controls you prefer to alter the colour
-
As soon as you make any changes, the Default button is enabled. You can click it at any time to show the workspace default palette.
- Click OK.
If the colours have been modified, then the chart will gain its own local palette unless you also apply the change to the workspace defaults. This means that the chart will not be affected by subsequent changes to the default palette (unless they are forced to apply to all current graphs too). Only if you click OK immediately after clicking the Default button will the chart revert to using the default palette.
Selection of the Monochrome option can be particularly useful for printing – see 5.8.5.2 Considerations for print.