For backwards compatibility, STEM 7.4 is supplied with the 16-colour palette used for charts in earlier versions of STEM. If you want to alter this selection of colours, or if you need to adopt a prescribed set of corporate colours, then proceed as follows.
- Select Colours from the Options menu. The Colours dialog is displayed and shows the current palette for graph data series, axes and gridlines.
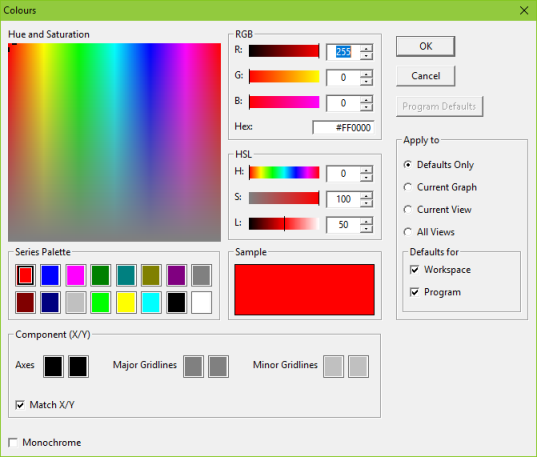
The Colours dialog defines the selection of colours used for data series, axes and gridlines
- Take a moment to familiarise yourself with the various controls in the dialog:
- the Hue and Saturation control is a familiar two-dimensional colour picker which can be used in conjunction with the Lightness control (the L under HSL)
- the Red/Green/Blue (RGB) controls allow you to control the respective colour intensities directly, or you can enter a so-called ‘web colour’ value in the Hex box
- the Hue/Saturation/Lightness (HSL) controls allow you to enter these alternative colour coordinates if you prefer
- the sixteen Series Palette colours are automatically assigned to individual data series on a chart as required
- the six Component (X/Y) colours apply to the axes and major/minor grid lines (two colours each: one for the x axis, one usually matching for the y axis)
- For each of the Series Palette colours that you wish to change in turn:
- click to select the relevant colour box
- use whichever of the RGB or HSL controls you prefer to alter the colour
- For each pair of the Component (X/Y) colours that you wish to change in turn:
- click to select the first colour box of the relevant pair
- use whichever of the RGB or HSL controls you prefer to alter the colour and the second colour of the same pair will change in step if they both matched initially
- uncheck Match X/Y first if you want the two colours to be different
- Click OK.
By default, the chosen colours will be saved both as workspace and program defaults, meaning that all future graphs will use these colours. The selected colours may also be selected as Standard Colours when re-colouring text on charts as described below.
Note: a results workspace loaded from an earlier version of STEM will not include any colour palette information and will therefore use the program defaults until such time as you choose to save the defaults for that workspace.