Currently, the business appears profitable from end Y6 onwards as a result of charging each customer a tariff of EUR 3.00/month. However, by this point the business will already have spent a lot of money on buying equipment, whereas revenue has only increased slowly. Each unit of resource costs EUR 1000/year (depreciation), but you will have outlaid EUR 5000 capital expenditure for each resource unit at the beginning.
When considering the aggregate value of the business, it is conventional to progressively discount future cashflows to allow for the cost of capital (i.e., to make a fair comparison with how capital could otherwise have been invested at the bank). Investors may also demand a further risk premium to compensate for the uncertainty inherent in most business plans. We will draw a graph of Net Present Value, which adds up discounted cashflow over the 10 years of the model run.
- Select Graphs/Draw and select Network and NPV in the Elements and Graphs tabs, respectively.
- Press OK to draw the graph.
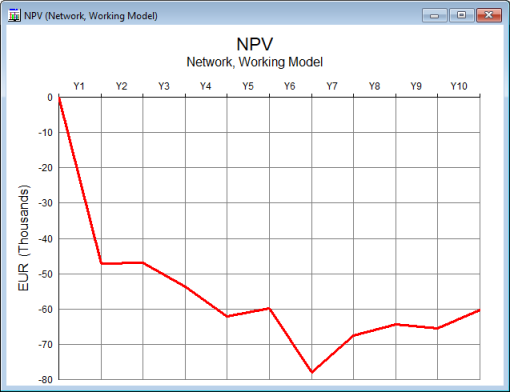
Graph of network NPV
Note: default discounted rate in STEM is 10%. Press <F1> with the NPV graph selected to access the Help system and find out more about what NPV means.
What does the graph show? Essentially, it shows that the business is not looking good! The NPV is nearly negative EUR 50,000 at the end of Y1 (due to EUR 50,000 capital expenditure, offset only slightly by small revenues), and then increases further up to Y6. Increasing revenue helps to offset this from Y6 onwards, but at end Y10, the NPV is still negative EUR 60,000.
The breakeven point is the point at which NPV becomes positive. In the next part of this tutorial we will determine what tariff we need to charge to achieve this.
 Things that you should have seen and understood
Cashflow
Net Present Value (NPV), Breakeven point