The profit and loss, balance sheet and cashflow statements presented above indicate how the various financial results interrelate. The terms and general concepts are described in 10.3.12 Financial model and network funding, but it is revealing and helpful to see the structure of the corresponding calculations, regardless of whether you intend to memorise the details!
Profit and loss
Within Figure 1 in 10.3.14 Financial statements, the operating items are all core model results:
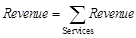


where, for a Resource, Operating Costs includes Maintenance, Churn, Connection, Rental, Usage, Operations, and Decommissioning Costs.
The Operating Profit in year n, On, is then calculated as:

The Net Interest Expense result is the difference between the two following results:


Each individual interest item in year n, In, is calculated from the corresponding average balance as:
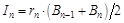
where
rn
= Deposit, Investment, Borrowing or Overdraft Rate in year n
Bn
= balance at the end of year n
for Cash Deposits, Investments, Long-Term Borrowing or Overdraft
Bn–1
= Initial Cash Deposits, Investments, Long-Term Borrowing or Overdraft input.
Thus the Pre-Tax Profit in year n, Pn, is calculated as:

The Tax Charge in year n, Tn, is calculated on profit after interest as:

where
Pn
= Pre-Tax Profit in year n
tn
= Tax Rate in year n,
giving Tax Paid, TAn, and Tax Payable, TBn, both in year n, as:
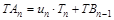

where
un
= Current Year Tax Proportion in year n,
TB–1
= Initial Tax Payable input
assuming that Pre-Tax Profit is positive or input Tax Relief Regime =
Immediate. If Tax Relief Regime = Limited or
Unlimited, the Tax Charge may be reduced if there is any outstanding tax relief.
Then the Net Profit in year n, Qn, is calculated as:
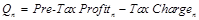
Dividends Declared in year n, Dn, are calculated on profit after tax as:

where
dn = Dividend Rate in year
n
Qn
= Net Profit in year n,
giving Dividends Paid, DAn, and Dividends Payable, DBn, both in year n, as:
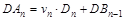
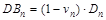
where
vn
= Current Year Dividend Proportion in year n,
DBn–1
= Initial Dividends Payable input
assuming Net Profit is positive. Otherwise there will be no Dividends Declared, but there might be some outstanding Dividends Payable.
Finally the Retained Profit in year n, Rn, is calculated as:

Balance Sheet
The presentation in compares total assets with total liabilities plus equity,

where

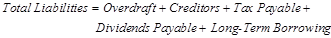
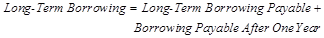
 (1)
(1)
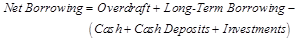
but in order to identify the net funding requirement or cash surplus, we must re-arrange these results, grouping all borrowing and cash items on the left.
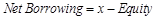 (2)
(2)
where
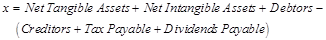
Note: The definition of the balancing variable, x, is similar to the usual definition of Capital Employed, but with the exclusion of the cash-like quantities.
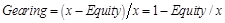
Now we wish to calculate a split between long-term borrowing and equity based on a desired gearing, to satisfy the equation:
 (3)
(3)
Substitute (2) into (3) to isolate equity:
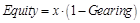
and then, from (1)

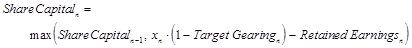
Now the algebraic manipulation above ignores the constraint on Share Capital, namely that it should not decrease, so in fact the actual calculations we use are:
Then we can calculate the Actual Gearing, which may be less than Target Gearing:

The size of the current account is calculated as a proportion of Operating Costs.

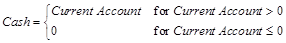
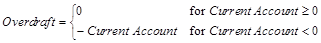
Having allowed for the current account, we can see if any borrowing is required, or whether there is a cash surplus.

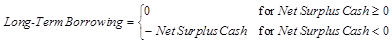
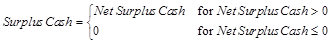
Finally we split the borrowing or surplus into short- and long-term components.


The circularity inherent in these calculations is that it is impossible to calculate interest income or expense until this split has been made, while all of the calculations above take retained earnings as given, which itself depends on retained profit, and in turn interest. Loosely speaking, the way this actually works is that an initial value for retained earnings is calculated on the basis of zero interest, and then the system simply solves the equations above by iteration. Since all of the tax and interest rates will be rather less than one, each successive iteration should make a relatively small correction to the previous one, which should guarantee convergence.
Cashflow
Many of the items in Figure 2 in 10.3.14 Financial statements can simply be calculated as movements in the corresponding items on the balance sheet (taking various year-zero inputs as initial values – strictly, for the beginning of year zero), while the remainder are either operating results or current-year proportions of tax or dividends, as described in the calculations for the profit and loss statement. Indeed the purpose of the cashflow statement is simply as a cross-check to ensure that the cash moving in or out of the business is properly accounted for.
All items on the balance sheet can be specified for the beginning of year zero, by the various year-zero inputs for the network, and the Service Initial Creditors and Debtors inputs. The only exceptions are initial values for Net Tangible Assets and Net Intangible Assets, which are specified implicitly by the pre-run installation of Resources, and are back-calculated by subtracting Capital Expenditure less Depreciation/Amortisation from the (end-of) year-zero results.
However, the given initial values may not balance with the calculated assets. In order to generate consistent results, the model may use a higher value for one of Initial Investments and Initial Long-Term Borrowing than was entered in the Editor. If the calculated assets are too high, Initial Long-Term Borrowing will be increased by the required amount; while if the calculated assets are too low, Initial Investments will be increased by the deficit. (The correction is applied to these particular inputs because they are the only long-term items on the balance sheet which are not constrained – neither Share Capital nor Retained Earnings can go down.)
If, however, it is the calculated assets which are wrong, rather than Long-Term Borrowing, then you will need to alter the pre-run Installation Profile of some of the Resources in your model. An increasing profile will increase the proportion of newly-installed Resources (with the highest written-down value) in year zero, while a decreasing profile will decrease this proportion – see 10.3.21 Pre-Run Installation.
Note: The inputs themselves are not modified, but the year-zero cashflow and interest are calculated from adjusted values. STEM will not alert you if this correction is necessary, but the Net Initial Assets Check result shows the scale of this correction.