When a Service is associated with a Market Segment, the size of its Customer Base is defined by the size of the Market Segment. (In a very simple model, you may prefer to define the size of a Service’s Customer Base as a time series specific to that Service, instead of using a separate Market Segment.)
Input data
When a Market Segment is associated with a number of Services, the icon menu for the Market Segment is extended to show all the usual Service data items. When you select, e.g., Demand, a tabular dialog appears showing Demand data side-by-side for each of the Services associated with the Market Segment – see 4.11 Editing Market Segment data.
Results
In the Results program, Market Segment results are automatically calculated as an aggregation over the corresponding Services. Thus it is possible to view results for Market Segments directly, and a set of Market Segment results and graphs is included in the standard results configuration,
default.cnf.
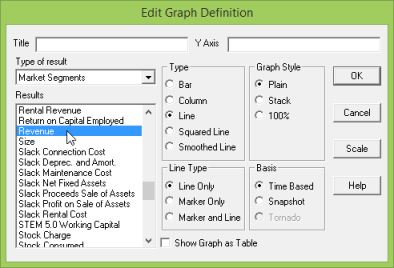
Figure 1: Market Segment results
Straightforward results such as Operating Costs are simply aggregated over the Services associated with a given Market Segment. However, results such as Operating Profit Margin (which is defined as Operating Profit/Revenue) are calculated as weighted averages of the corresponding Service results, according to an appropriate measure (Revenue, in this case).
Example
Suppose you wish to model the provision of POTS and ISDN to Residential and Business users. You would create four separate Services, with two common Market Segments, as shown in Figure 2 below.
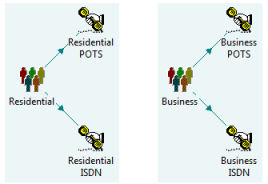
Figure 2: POTS and ISDN to Residential and Business users
If you then want to view demand data for the business Services side-by-side, select Demand from the icon menu for the business Market Segment to display a tabular dialog, as illustrated in Figure 3.
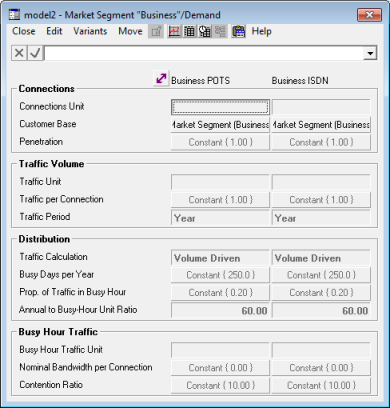
Figure 3: The Market Segment Demand dialog