The most frequently calculated ratios are straightforward profit margins, expressing Operating Profit, Pre-Tax Profit or Net Profit as proportions of Revenue (i.e., the total turnover generated in the network). These results are called Operating, Pre-Tax and Net Profit Margin respectively.
Another popular measure, Return on Capital Employed, expresses Operating Profit as a proportion of Capital Employed (i.e., total net assets held in the business).
From the above ratios, the most useful are Operating Profit Ratio and Return on Capital Employed (also called return on investment). They are derived from the operating results which appear higher up in a profit and loss statement and provide a better measure of the performance on a continuing basis, as they are not affected by the interest on loans (capital structure), change in tax rates, dividend payments and extraordinary items.
It should be emphasised that ratios examined in isolation are often meaningless. They should be put in context with other companies’ performance and industry averages. This is particularly true for the Return on Capital Employed, as some industries are much more capital-intensive than others.
Per-connection ratios
In addition to the comparative results described above, STEM also calculates a number of per-connection results, i.e., various quantities divided by the number of Connections for a Service or the network. Examples of such results are Revenue/Conn, Operating Costs/Conn and Operating Profit/Conn.
The Operating Charge/Conn result is the sum of the Deprec. and Amort./Conn and Operating Costs/Conn results; while the Overall Charge/Conn result accounts for Net Interest Expense and Tax Charge as well, and is the ratio of Overall Charge to the total number of Connections in the network. The relationship between these ratios is illustrated in Figure 1 below.
These ratios are very useful when assessing the financial performance of start-up operations, e.g., evaluating the economics of new technologies such as GSM, wireless in the local loop (WLL) and CATV. Revenue/Conn and Operating Charge/Conn are particularly relevant in this context.
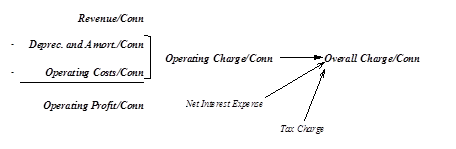
Figure 1: Per-Connection Ratios
Advanced financial ratios
STEM provides parameters which describe the way the network is funded as a business – see 10.3.12 Financial model and network funding – and this extra detail allows for the calculation of a number of extra financial indicators.
All of these ratios are summarised below, and the precise definitions are given in the full list of results at the end of this section. These financial indicators are included as an output table,
find.xls, in the standard results configuration,
default.cnf.
|
Average Creditor Days
|
Weighted average of Service inputs |
|
Average Debtor Days
|
Weighted average of Service inputs |
|
Operating Profit Margin
|
Operating Profit as a proportion of Revenue
|
|
Pre-Tax Profit Margin
|
Pre-Tax Profit as a proportion of Revenue
|
|
Net Profit Margin
|
Net Profit as a proportion of Revenue
|
|
Asset Equity Ratio
|
The ratio of Total Assets less Cash Deposits and Investments to Equity
|
|
Asset Turnover
|
The ratio of Revenue to Total Assets less Cash Deposits and Investments
|
|
Dividend Cover
|
The ratio of Net Profit to Dividends Declared
|
|
Fixed Asset Turnover
|
The ratio of Revenue to Net Tangible Assets plus Net Intangible Assets
|
|
Interest Cover
|
The ratio of Operating Profit to Interest Expense
|
|
Interest Service Ratio
|
The ratio of Cashflow from Operations to Interest Expense
|
|
Return on Assets
|
The ratio of Operating Profit to Total Assets less Cash Deposits and Investments
|
|
Return on Capital Employed |
The ratio of Operating Profit to Capital Employed
|
|
Return on Equity
|
The ratio of Net Profit to Equity
|
|
Working Capital Current Ratio
|
The ratio of Current Assets to Current Liabilities
|
Figure 2: Financial Ratios Summarised
Note: Capital Employed is Total Assets, less Cash Deposits and Investments, less Current Liabilities.
The Du Pont Equation
In particular, four of these indicators satisfy the so-called Du Pont equation:

or
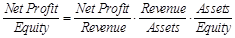
where for compactness we are taking
Assets = Total Assets less Cash Deposits and Investments.