When you define the font for a graph or table as a whole, or for an individual heading or label on a graph, the Change Font dialog now has a Colour button which enables you to pick an arbitrary colour value from a single Select Colour dialog (which may at first glance look similar to the Colours dialog).
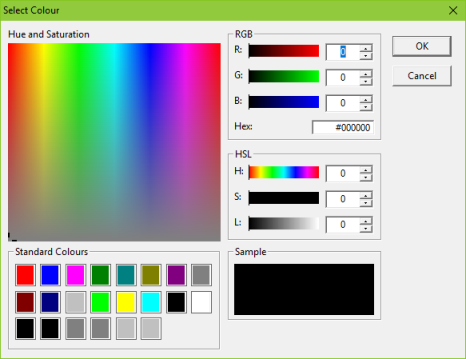
The Select Colour dialog offers the main palette entries as Standard Colours
However, the scope of the Select Colour dialog is limited to changing the one colour for which it was summoned:
- Use whichever of the RGB or HSL controls you prefer to alter the colour.
- More straightforwardly, you can click one of the Standard Colours to pick a colour from the standard palette for consistency with other graph items.
- Click OK.
Note: we did not extend the colour palette to include entries for every possible text item as we considered that it would be rare to use more than one text colour in the first place. As you will see below, not only can you define a default graph font and colour, you can even define and save a separate default font and colour for each individual title and label!