The set of elements in a model may be considered to be two dimensional when using template replication (and more with cost breakdown). Equally, the set of scenarios may be generated from multiple dimension elements. Nevertheless, at a higher level, the data you are selecting for elements × results × scenarios can be thought of as a three- dimensional ‘cube’ of potential data points: for example, if you select three elements, three results and three scenarios, you have an implied 27 data points.
This would be far too many series for a single graph, so the Slice option and drop-down menu of shortlisted selections as described above effectively allow you to filter what is shown on a graph to a thin slice of this data (for example, 3 elements × 3 results × 1 scenario at a time = 9 data points, across one scenario slice).
In practice, a cube may be sparsely populated, after using the Add Series… or Remove Series… commands, but the filtering by element, result or scenario of the slice drop-down still applies.
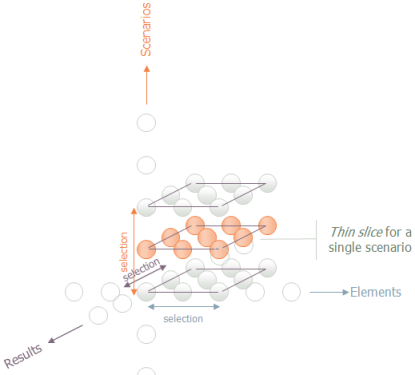
Notional data cube of elements × results × scenarios, and selection of a thin slice
We may add the ability in the future to select more than one of these thin slices at a time (i.e., a ‘thick slice’ – for example, two out of three scenarios).