If we return to the calculated number of failures each period, we may wish to model the consumption of spares directly. However, unlike the immediate consumption and billing of engineer hours (or indeed power), spares may be supplied and purchased in a greater quantity than is actually used up in a given period. Assuming that they have a non-trivial shelf life (captured in the
Physical Lifetime
and new Lifetime Months
inputs), then STEM must account for the disconnect between the cashflow impact of purchasing the spares and the recognition of the cost at the time of consumption for accounting purposes.
Consider a consumable resource representing a package of 16 spares at a total cost of €160, and suppose that there are three failures a quarter, requiring three spares to be used up each quarter.
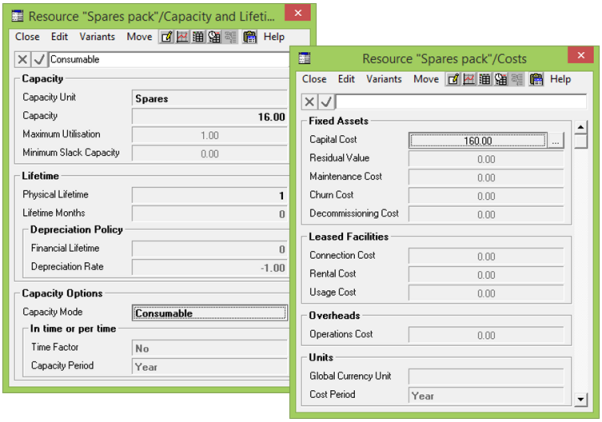
Figure 1: Modelling a consumable resource package with a shelf life
Then, in Q1 we would need to buy one package, but only three spares would be used. In Q2, we would not need to buy any more, as we would have 13 ‘slack’ from Q1. In Q2 we would report 3 used up, 3 used and now just 10 slack, as illustrated below.
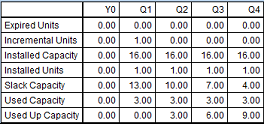
Figure 2: Consumable installed capacity = slack + used + (already) used up
When the amount of Used Up Capacity
would exceed a whole unit, these fully used up units are removed (shown as Expired Units). If and when an installed unit reaches the end of its shelf life, then it expires and any remaining slack capacity is removed and written off.
Consolidation of aggregate results
A new Consumption
result has been added (defined for consumable resources only). This is the same as
Used Capacity
for any individual run period, but it behaves differently when monthly or quarterly results are consolidated.
Used Capacity
for a year is always consolidated as the result for the last month or quarter, whereas
Consumption
is summed over the corresponding months or quarters as an aggregate quantity.
Unfortunately it is impossible to compare the Consumption
of a consumable resource to its
Incremental Capacity
in the same period in a meaningful fashion if there is any carry forward of unused capacity from one period to the next, as the capacity being used up may have been installed in an earlier period. However, if there is a zero lifetime which guarantees that all
Incremental Capacity
is used or written off in the current period, then a Gross
Consumption
result is defined to be the same as Incremental Capacity
for any individual run period, and then aggregated when monthly or quarterly results are consolidated.
This allows for a new Average Utilisation Ratio
result, which is defined as Consumption /
Gross
Consumption, and which can be consolidated to show aggregate Consumption
/ aggregate Gross
Consumption
over the corresponding months or quarters, in contrast to the standard
Utilisation Ratio
result which always consolidates to the last period.
Accounting for stock purchases and subsequent consumption
The purchase cost of €160 is entered in the box for
Capital Cost, but this cannot be thought of as a capital item, nor is depreciation the right way to look at allocating costs. Instead, a new set of ‘stock’ results is generated for a consumable resource of this type.
The logic is rather similar to capex, depreciation and written down value, except that the
Stock Consumed
result is a function of used capacity rather than time. The
Stock
result is used to capture the value of stock remaining on the balance sheet and appears under
Current Assets
as opposed to Long Term Assets for capital items. The
Stock Purchases
result arises in the period that new spares are purchased, whereas it will be
Stock Consumed
which can be meaningfully allocated to the profit and loss account and individual services.
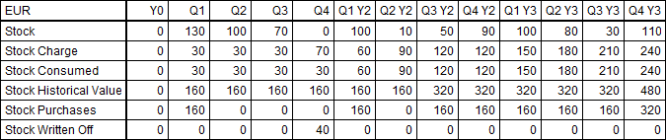
Figure 3: Purchases, charging and stock remaining of a consumable resource
The value of any unused stock which is discarded at the end of its shelf life is shown as
Stock Written Off, and the combined impact on the profit and loss account is shown as
Stock Charge
= Stock Consumed +
Stock Written Off. The net impact on network cashflow is shown as
Change in Stock
= Stock Purchases –
Stock Consumed –
Stock Written Off.
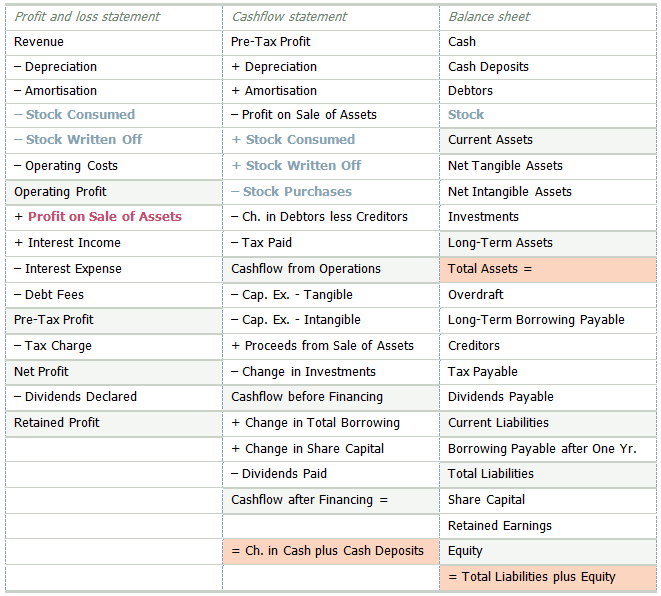
Figure 4: How the new stock results are treated in the various financial statements
Notes on the financial statements
In the STEM 7.2 documentation,
Profit on Sale of Assets was shown above Operating Profit, whereas it was always correctly implemented between
Operating Profit and Pre-Tax Profit as is now shown above.
The new stock items are shown in full in Figure 4
to make it clearer how they fit together, whereas the financial statements implemented in
default.cnf
reflect stock more concisely given that it is typically not the item of greatest interest. The regular cashflow statement just shows the single
Change in Stock
result; similarly, the profit and loss statement just shows the single
Stock Charge
result.
Cost allocation
Stock Consumed
is allocated to transformations and services in the same way as other
Operating Costs
and Depreciation, and is implicitly a ‘used cost’ like
Operations Cost
or Usage Cost. There is also a
Direct Stock Consumed
result which allows for the utilisation of any intermediate resource transformations.
Stock Written Off
only exists as a ‘slack cost’ and is therefore only allocated to services.