Direct cost results allow for costs driven by intermediate demand from partially slack equipment, and vary more closely in relation to the underlying service demand than used cost results. Direct costs represent the cost of a fully efficient network and are the keenest indicator for tactical pricing.
Used and slack cost results distinguish between the allocated costs of used and slack Resource capacity. The Used Maintenance Cost result for a Service is the share of costs from the used portions of all Resource capacities allocated to that Service. This is the cost of equipment which, if removed, would directly compromise the Service. The cost of slack capacity reflects the combined cost of planned redundancy and network inefficiency. The sum of these used and slack costs represents the fully allocated cost of providing a Service.
The concept of used capacity is contextual. Suppose that one connection for a Service requires one port on a 100-port switch, and that each switch requires a single-switch management interface (MI).
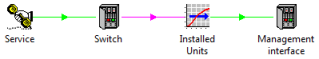
With a demand of 50 connections, a single switch will be 50% utilised, but the single MI will
appear
to be 100% utilised if it is dimensioned on the basis of capacity with respect to installed switches. The network will not function without the MI, whereas it would be fine with fewer ports on the switch
The MI used cost will be the same right up to 100 customers, whereas it would be more useful to grasp the underlying cost per connection when considering how network costs will scale as demand grows. The direct cost results are a refinement of allocated used costs, designed to allow for the utilisation of equipment generating a secondary cost. In this example, the full used cost of the MI is allocated back to the switch, but only 50% of this is then designated to the Service as a direct cost.
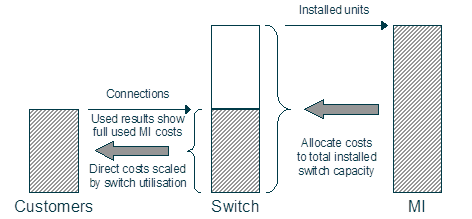
Figure 1: Allocation of used and direct costs
Direct cost results are more closely variable with the underlying service demand than used cost results, factoring out jumps caused by unit capacities of equipment. They therefore identify the cost of a fully-efficient network, and provide a keener indicator for tactical pricing.
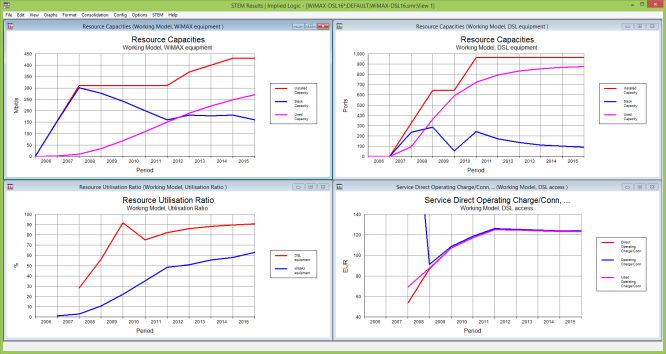
Figure 2: Comparison of direct, used and fully allocated costs