If you provide a concise description of a time series, e.g., as an S-Curve, it can be very useful to preview the way that STEM will interpret the parameters you have specified. In order to display a graph from a time-series dialog:
- click the
 button on the inner dialog menu, or
- press <Alt+G>.
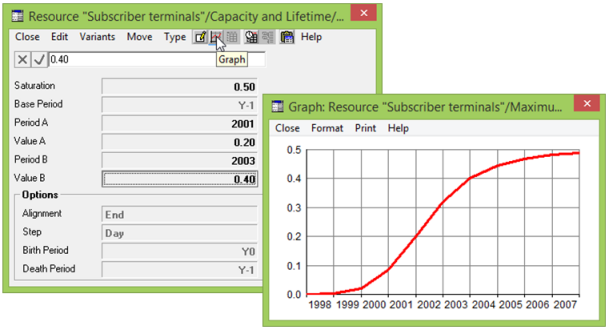
Figure 1: Displaying a graph of an S-Curve time-series input
It is also possible to automatically display a graph of whatever input parameter is entered – see the next subsection on the Auto Graph feature.
You can right-click on a graph, or use the Format menu, to change the way a graph is displayed, or to show the corresponding values as a table – for more details, see 5. Results program skills.
You can return to the time-series dialog without closing the graph:
- click on the time-series dialog, or
- press <Ctrl+F6>.
Any changes you make to the parameters will be immediately reflected on the graph.
Note: A graph will be blank if the time-series parameters you have specified are not valid, e.g., if you have not defined the Model Start Year.
Automatically previewing inputs with Auto Graph
You can use Auto Graph to display a window which will remain on screen and automatically
show a graph of whatever input parameter is selected.
-
Click on the Graph button on the main toolbar to display the Create Graph dialog. (The dialog can also be displayed by clicking on the Graph button on any data dialog apart from
one showing parameters for an individual time series.)
- Click on the Auto Graph button. The Auto Graph window is displayed, and the graph it shows will be updated automatically to represent whatever input is currently selected, in any dialog within the Editor.
Auto Graph can compare multiple inputs: simply hold down the shift key and select the required inputs.
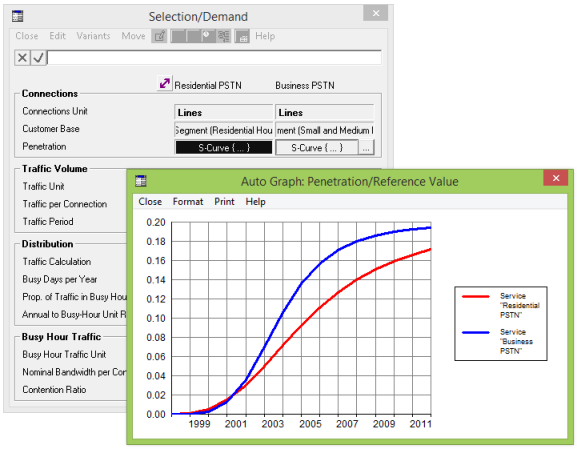
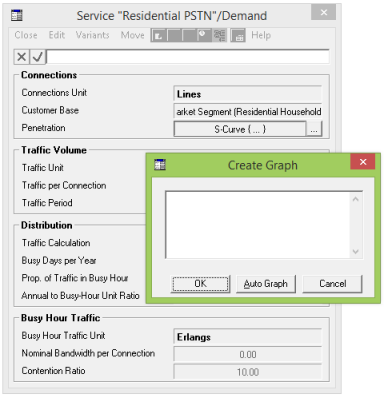
Figure 2: Using Auto Graph to compare multiple inputs
You can choose to run Auto Graph automatically whenever the Editor is run.
- Select Auto Graph from the main Options menu.
- Select Save Options from the main Options menu.
Note: The Save Options command allows you to save the current settings for items on the Options menu (e.g., to run Auto Graph automatically or whether you want elements to be named automatically when you create them). The settings are stored in STEM.INI.
Comparing several time series on one graph
If you have several related time-series inputs which you would like to compare, you can create a custom graph with separate lines for each of those inputs:
- click the button on the menu of the dialog containing the field cell for that time series, or
- click the similar but larger button on the toolbar, or
- select Create Graph from the main Data menu, or
- press <Ctrl+G>.
The Create Graph dialog is displayed, which is used to select the inputs you wish to compare, before creating the graph itself.
Figure 3: The Create Graph dialog
-
For each time-series input you want to include on the graph, simply left-click on the field relating to that input (e.g., Penetration). An internal reference describing each input is added to a list in the Create Graph dialog – see 4.12.3 Internal references and reference mode.
- Click OK to create a graph comparing the selected inputs.
If, when the graph is displayed, the selected inputs have anything in common, this information is presented in the graph caption. The distinct information is presented in the graph legend. The example in Figure 4 compares the Penetration inputs for two Services.
Note: This procedure is not restricted to time series: you can compare any scalar or time-series numeric inputs by clicking on the corresponding fields.
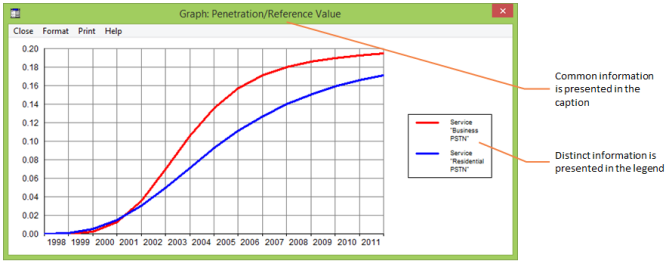
Figure 4: A graph of two separate inputs