The Format Gridlines and Change Gridline Style dialogs can be accessed by right-clicking on the graph and selecting Select Graph Item…, followed by Gridlines, and then selecting either Format Gridline… or Change Gridline Style…. The same options can also be accessed by right-clicking on the axis itself, or by double-clicking on the axis to access the Format Gridlines dialog directly.
Format Gridlines
Selection of this command displays a dialog where you can indicate whether you want Major and Minor gridlines to appear on the X and Y axes of your graph. (These options can also be changed from the Format Category [X-axis] and Format Value [Y-axis] dialogs – see Gridlines.)
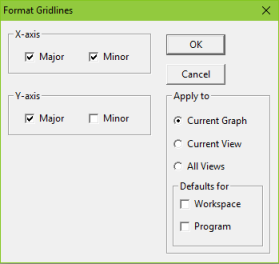
The Format Gridlines dialog
Change Gridline Style
Using this dialog, you can change the Automatic Style, thickness (Width) and Colour in which the X/Y (Major/Minor) gridlines appear in graphs.
If you do not want any gridlines at all on a graph, select None.
Changing any of the drop-down list boxes, will automatically highlight the User defined option for Major or Minor gridlines as appropriate.
The Sample boxes show the effects of any changes you make.
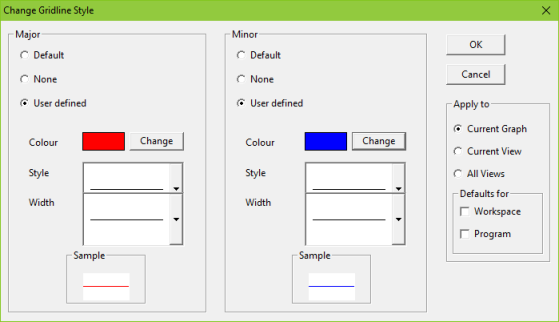
The Change Gridline Style dialog showing User defined options
Selection of Change will take you to the Select Colour dialog. Unlike setting the colour for text, changes here will alter the corresponding palette entries for the given chart directly and will cause it to have its own local palette unless you also apply the change to the workspace defaults. Therefore, it is not recommended to alter chart colours in this way unless you specifically want a given chart to look different.
Apply to
Both these dialogs have the same consistent choices for Apply to available in other dialogs – see 5.8 Formatting graphs.