The table layout can be changed to display the data in a number of different ways. The layout of individual tables can be changed using the Layout… command on the Format menu, while the Table Layout… command on the Options menu can be used to set the default table layout. The two dialogs are essentially the same.
-
Click on the Layout… command on the Format menu (or right-click on the table and select Layout… from the pop-up context menu). The Change Table Layout dialog is displayed.
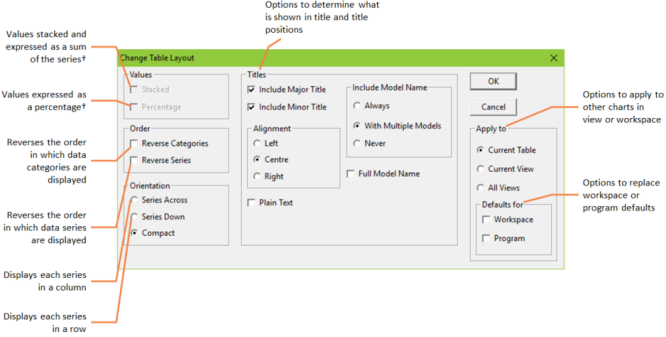
The Change Table Layout dialog
†Option only available if graph has been drawn using Stacked or Percentage values.
By default, tables are laid out in the most compact manner (the Compact option on Change Table Layout dialog): if there is only a single series, it is displayed as a column, while if there is more than one series, each is shown as a row.
Values
Stacked: this type of layout is only available on Stacked and Percentage style graphs. Values are expressed as a sum of the series, e.g., if there are three series each with values of 2, 3 and 5 respectively, then their stacked values will be 2, 5 and 10.
Percentage: this type of layout is only available on Percentage type graphs. Values are expressed as a percentage. For example, using the figures above, the percentages will be 20%, 30% and 50%.
Note: If you have Stacked and Percentage checked, then values are expressed as summing to 100%, e.g., using the figures above: 20%, 50% and 100%.
Order
Reverse Categories: reverses the order of the categories. For example, if the categories are the years 1994 to 2004, then checking this box will reverse their order to be 2004 to 1994.
Reverse Series: reverses the order of the series. For example, if the table shows a result for Resources A–G, reversing the series will show them listed G–A.
Orientation
Series Across: when this check box is selected, series are listed across the table.
Series Down: when this check box is selected, series are listed vertically down the table.
Compact: this is the default way that series are displayed. If there is only a single series, its values are displayed in a column (same as selecting Series Across); when there are several series, their values are displayed in rows (same as selecting Series Down).
Apply to
Future Defaults Only (only available in the Change Table Layout dialog accessed from the Table Layout command on the Options menu): apply selected settings to all future results tables.
Current Table: apply selected settings to the current table only.
Current View: apply current settings to all tables in the current view.
All Views: apply current settings to all views in the workspace.
Defaults for Workspace: replace the current workspace defaults with the currently selected settings.
Defaults for Program: replace the current program defaults with the currently selected settings.