-
Draw a graph as described in 5.2 Drawing graphs.
- Select Show Graph as Table from the Format menu, or right-click within the main graph area and select Show Graph as Table from the pop-up context menu.
- The table is displayed as an alternate view within the original graph window, with the numerical data presented in rows and columns. Tables can also be formatted individually.
Note: to show the table in a separate window, select Show Separate Table…
from the main Format menu or from the graph pop-up menu.
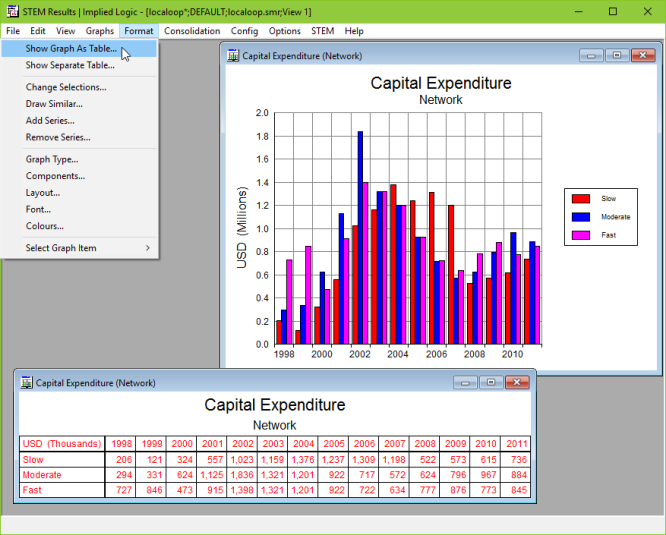
Viewing graphs as tables
When a table is first shown, its size is governed (within the confines of the screen) by the number of rows and columns in the table, and the actual widths of the label and value texts. You can click and drag within the table to vary the width of the columns or to re-size the table. These dimensions are retained if you switch to showing as a graph, and then back as a table.
Right-click within the main table area and select Show Table as Graph from the pop-up menu to convert the table back into a graph. To show the table data as a graph in a new window, select Show Separate Graph… from the main Format menu or from the table pop-up menu.