Suppose, for example, you are looking at the demand assumptions for a Service, including a penetration curve set to grow at 5% per annum from a base of 50%:
-
Select Demand from the icon menu for a Service. The Demand dialog is displayed, with buttons to access the relevant parameters for each separate time-series input – see 4.7 Viewing and editing time series.
In order to display the time-series view:
-
Click the
 button, or select Time-series View from the dialog Move menu, or just press <Alt+W>. The dialog is extended with columns of numerical data for each year or period of the model run, complementing the usual buttons.
In this example, the 50% Base of the Exponential Growth is displayed in black in the column for Y0 (which is the Base Period for the series), while the remaining values are shown in grey.
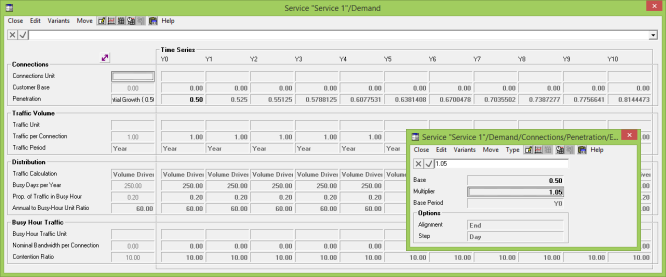
Time-series view for Service Demand
Note: Scalar and textual inputs are repeated across each row and can be edited identically in any column.