An S-curve will typically present two key parameters in a time-series view: Value A and Value B, displayed in the columns corresponding to Period A and Period B respectively. These values can both be modified directly.
If you ask the Editor to adjust calculated values when modifying a calculated value, then the S-curve Saturation is implicitly re-calculated to achieve the desired result, and the S-curve flexes to accommodate the new value (which stays grey as it remains a calculated value).
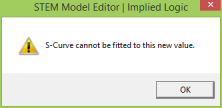 However, this may not be possible if, for example, you enter a value outside the range Value A to Value B for a period between Period A and Period B. In this event, STEM will explain the limitation as shown.
Otherwise, if you use <Shift+Enter> to change just a single value, then the S-curve will be implicitly changed to an Interpolated Series.