If you have a data dialog on the screen, all you have to do to print it is:
- Select Print… from the File menu. The Print dialog is displayed.
- Select Current Data Dialog from the list of what to print.
- Click OK or press <Enter>. The data dialog is printed.
All the labels and values from the dialog are printed using the same font as on the screen – see 4.5.3 Formatting data dialogs. Time-series fields are simply shown exactly as per the usual summary on buttons.
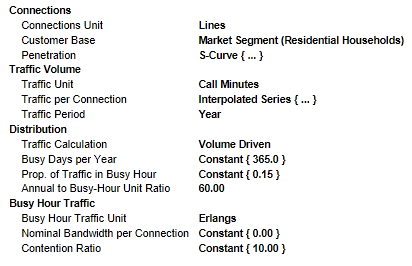
Figure 1: Sample print-out from a Service Demand dialog
Note: You can click on the  button, or select Copy All Text from the dialog Edit menu, to copy the corresponding text to the Windows clipboard.
Printing a tabular dialog
There are no restrictions on the size of dialog you can print, so you can employ exactly the same procedure to print out a table for all elements in a model. In fact this is a useful technique for generating a concise summary of a certain class of inputs to a model.
When you print a tabular dialog, the print-out will show all the elements in the table, even if not all of them are visible on the screen (when the dialog has scroll bars). In most cases, this print-out will span several pages, and you may wish to modify the printer setup to use landscape format, and include a page count in the footer – see 4.20.1 Changing the printer setup. When a dialog is printed on more than one page, the field labels and column headings will be repeated on each page, so that each page of the print-out is intelligible.
In the usual orientation with one column for each element, pages are printed down, and then across, in order to keep the data for each individual element together.
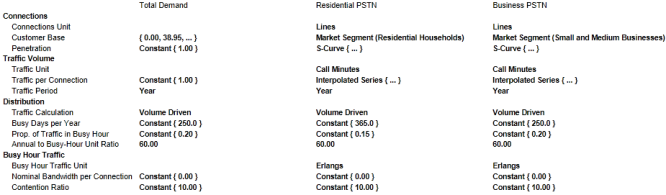
Figure 2: Sample print-out from a tabular dialog
Printing an Interpolated Series dialog
If you want to print out the data for an Interpolated Series, Tax and Interest Rates or Resources Required, the procedure is still the same. Again, if there are more Years than those shown on the screen, they will all be printed. To ensure that the data is all printed on a single page, it may be useful to click on the  button of the tabular dialog to flip the rows and columns, so that the Years will be running down the page, and to select the Landscape setting in the Print Setup dialog.
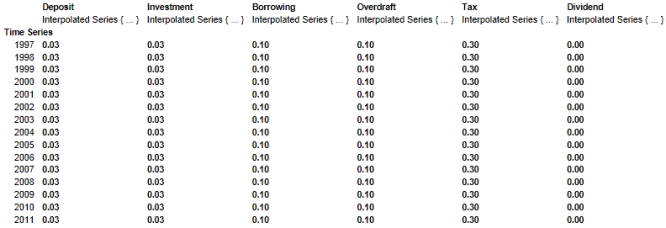
Figure 3: Sample print-out from the Tax and Interest Rates dialog
Note: The print-out will contain blanks where an individual time series specifies no value for a particular year. (The interpolated values which will be used in the model are shown in grey on the screen.)